Reports
The dashboard shows you the numbers; Reports turn those numbers into a written story. A report is an AI-generated document — KPIs, charts, and plain-language insight pulled from your space’s data — that reads like something one of your agents wrote for you.
What you can generate
You pick a report type, and Inkome generates it. The available types are:
| Report | What it covers |
|---|---|
| Monthly Business Review | A monthly performance overview with KPIs, charts, and AI insights. |
| Quarterly Business Review | Quarter-over-quarter trajectory and strategic outlook. |
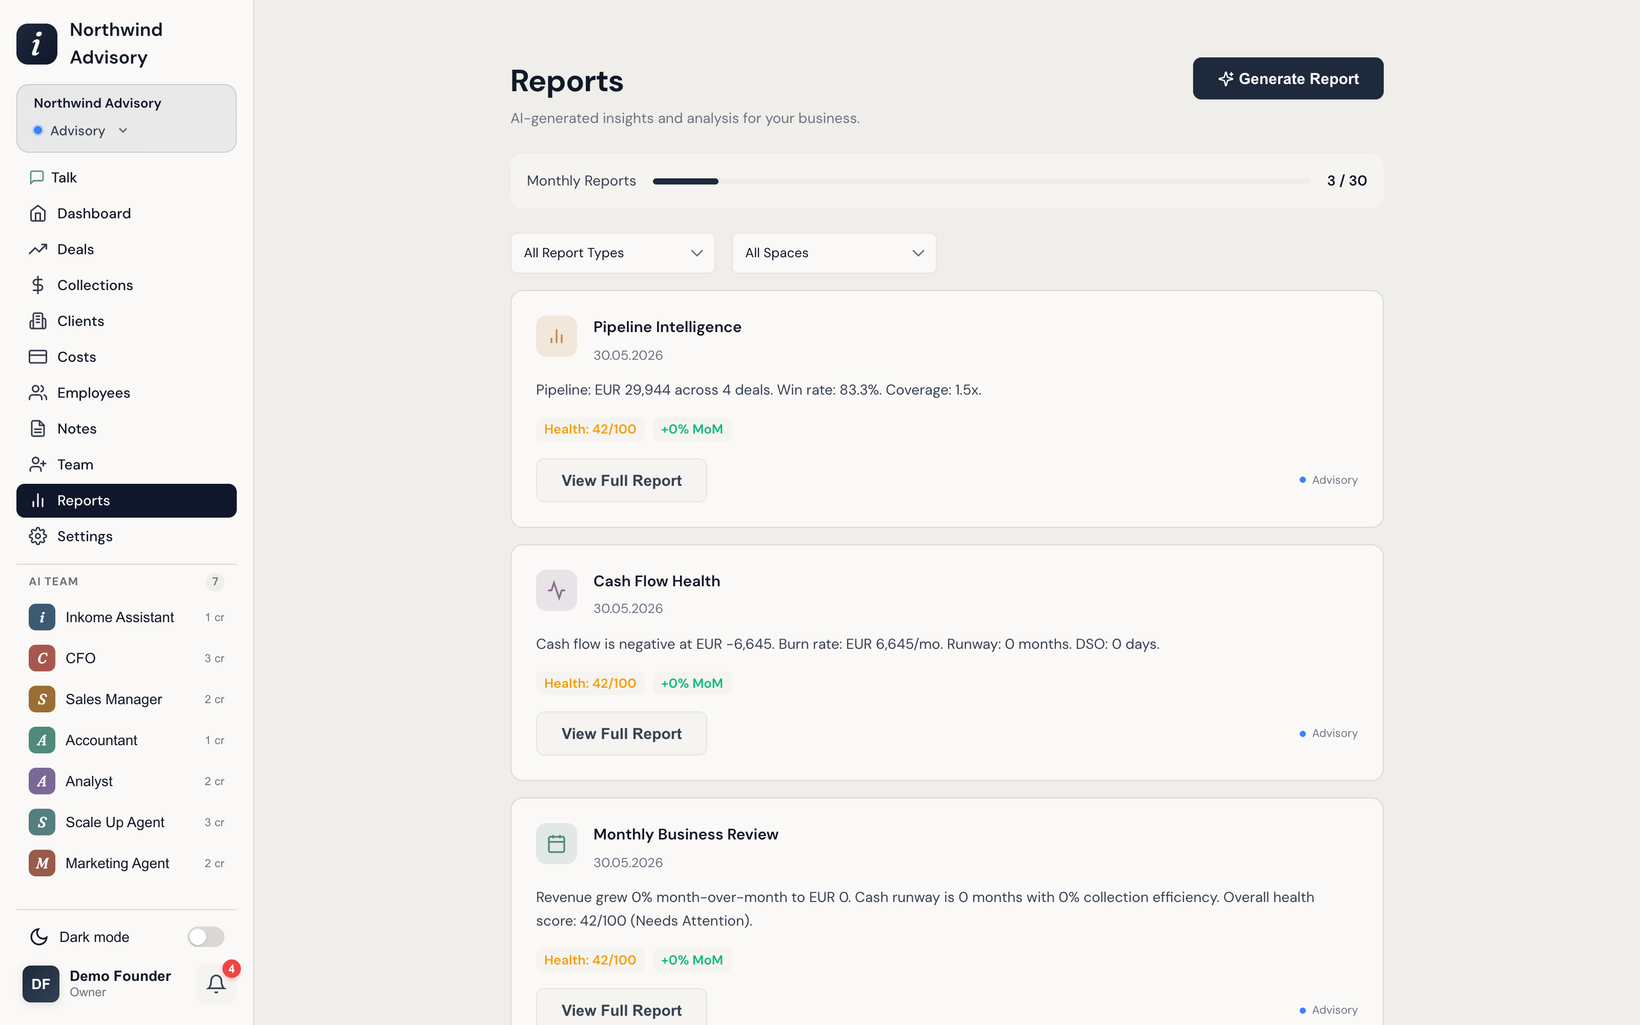
| Cash Flow Health | Cash position, burn rate, runway, and sustainability. |
| Pipeline Intelligence | Pipeline quality, velocity, win rates, and deal-risk assessment. |
| Revenue Forecast & Scenarios | 3-, 6-, and 12-month projections across optimistic, baseline, and conservative scenarios. |
| Collection Efficiency | Payment-collection performance, DSO analysis, and optimization insight. |
| Investor Update | A VC-ready monthly update with key metrics and highlights. |
| Financial Health Scorecard | A multi-dimensional health assessment across five business dimensions. |
How to generate one
- Open Reports and choose Generate.
- Pick the report type from the list above.
- Inkome builds it in the background — the report shows a generating state, then becomes available to open.
- Open it to read the full report, or download it (see Exporting data).
Generation runs on your data at the moment you ask for it, so a report is a snapshot in time. Generate a fresh one whenever you want the latest picture.
Limits
Reports are one of Inkome’s heavier AI tasks, so how many you can generate each month depends on your plan. If you hit the cap, you’ll see a Monthly Limit Reached message and a prompt to upgrade. See Credits & limits for the per-plan numbers, and Billing & plans to change plans.
Reports vs. the dashboard vs. the chat
These three overlap but serve different moments:
- The dashboard is the live, always-on view — glance at it any time.
- A report is a generated, shareable document for a specific period or question.
- The AI assistant is conversational — ask a one-off question and get an answer (and often a chart) in the chat.
Prev: The dashboard Next: Exporting data (Excel / CSV) Up: User guide index