The AI assistant
This is the part of Inkome you can’t get from a CRM or an accounting tool: an operations team you can’t afford to hire, sitting inside your data. Instead of one generic chatbot, Inkome gives you a set of specialist agents — a CFO, an Analyst, a Sales Director, an Accountant — that you talk to in plain language, and that answer using the real numbers in your space.
What it is
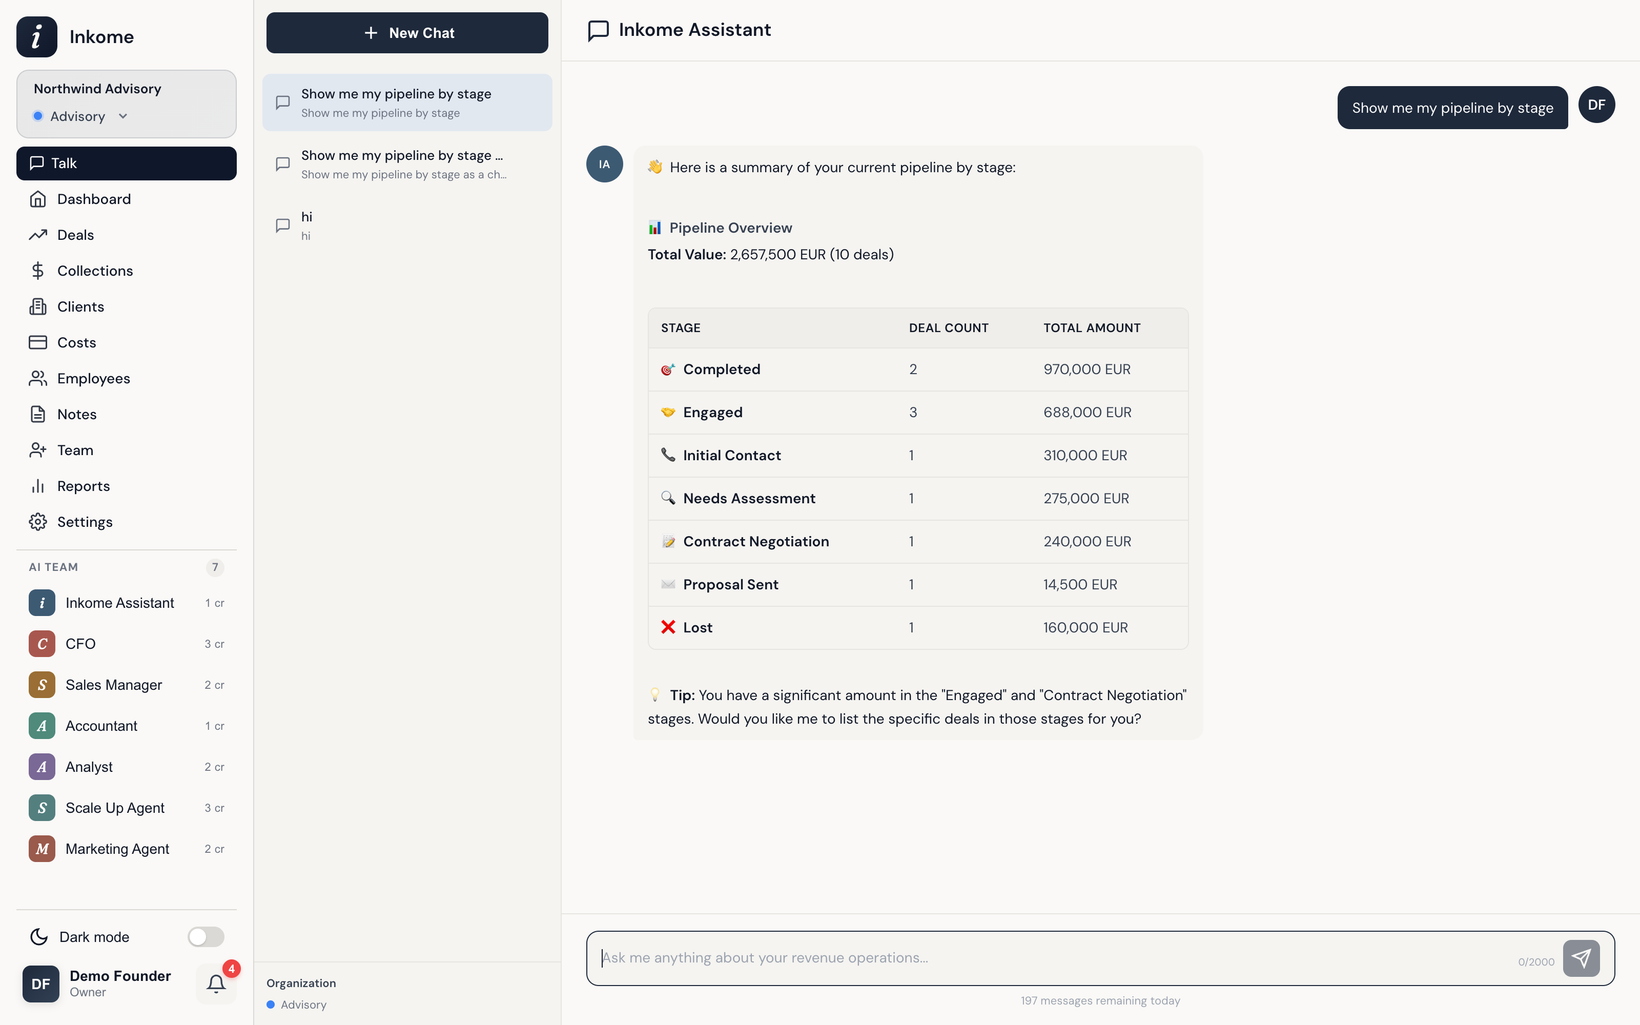
The assistant is a chat. You type a question — “how’s our pipeline this quarter?”, “when are we going to run out of cash?”, “which client owes us the most?” — and an agent answers. The difference from a normal chatbot is that these agents are wired into your data and your business, so the answers are about your deals, your collections, your costs.
It’s built to augment, not replace you. The agents surface what you’d miss and do the legwork; you keep the judgment.
Opening and using the chat
- Open the chat from the app. Start a new conversation, or pick up a past one from the conversation list on the side.
- Type your message and send it. The assistant figures out which specialist should answer (see Mentions, routing & delegation).
- You can keep the conversation going — agents remember the thread, so follow-ups like “and last quarter?” work.
- Conversations are tied to your current space, so switching spaces gives you a fresh, in-context chat.
Picking an agent yourself
You don’t have to let Inkome route for you. Type an @mention — like @CFO or @Analyst — to send your message straight to a specific agent. As you type @, an autocomplete list of available agents pops up so you can pick one without remembering the exact name. Full details are in Mentions, routing & delegation.
Streaming answers
Replies stream in as they’re produced rather than appearing all at once. You’ll see the active agent and a sense of what it’s working on while it gathers data, then the answer fills in. If a reply is taking a direction you didn’t intend, you can stop it mid-stream and send a new message.
Charts in the chat
Some answers come with a chart, not just text. When an agent’s answer is better shown visually — a trend, a breakdown, a comparison — it renders a bar, line, or pie / donut chart right inside the reply. These are the same kinds of visuals you see on the dashboard, generated on the fly for the exact question you asked.
Where to go next
- Meet the agents — who’s on the team and what each one is good at.
- Credits & limits — how usage is counted and capped per plan.
- Web search — when agents look things up beyond your data.
Prev: Filters & saved filter groups Next: Meet the agents Up: User guide index